Advances in natural language technologies have enabled the development of business intelligence (BI) tools that allow us to delve deeper into our data than ever before. Natural language processing (NLP) is a field of artificial intelligence that enables computers to understand, interpret, and generate human language. In simpler terms, it’s what allows machines to “read” and respond to our own words just like a human would. Whether you’re asking Siri a question, or a chatbot is helping you online, that’s NLP in action. By using powerful artificial intelligence algorithms, companies are now able to bridge the gap between raw numbers and meaningful analysis with NLP.
Two industry-leading data visualization tools, Tableau and Power BI, both offer data natural language query capabilities. But how do they stack up? In a showdown between Tableau and Power BI, we examine each BI platform’s current capabilities and differences and uncover their plans for facilitating data querying through NLP.
Tableau’s Ask Data
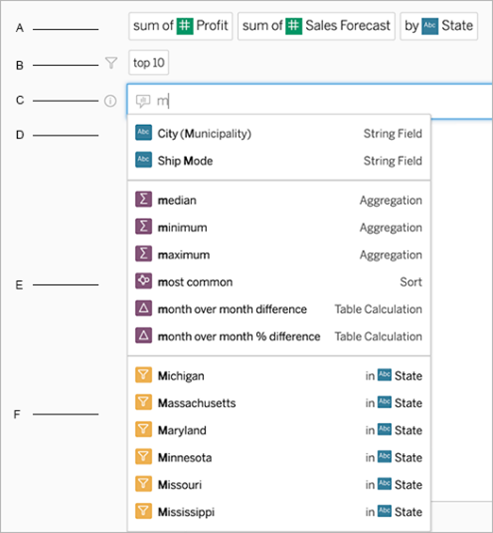
Tableau’s Ask Data is a cutting-edge feature that facilitates natural language querying of data, rendering data visualizations as responses. Central to this BI system are ‘lenses’ crafted by a Tableau author, which clarify the data fields being utilized. Users can access these lenses from various areas, such as the All Lenses page or the Ask Data tab. Query-building is expedited through automatic search and display of relevant data fields, functions, and string values, further assisted by dynamic phrase suggestions. Queries can be tailored by adding fields, filters, aggregation types, or groupings. Users can create multiple NLP visualizations from a single lens and share these with others via email or a link. To maximize the efficacy of Ask Data, users are advised to utilize keywords, precise field names and values, table calculations, and quote encapsulation for longer values.


Power BI’s Quick Measure Suggestions with Co-Pilot
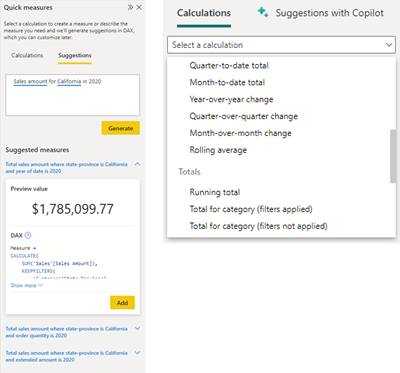
The Quick Measure Suggestions with Co-Pilot feature in Power BI, backed by machine learning algorithms, offers a more intuitive and efficient method of creating DAX measures. It reduces the reliance on intricate DAX codes or templates, substituting them with easy-to-use natural language expressions. By simply expressing the needed measure in common language, like “Total Sales in the East Coast for 2022”, users can swiftly construct DAX measures suited to a variety of situations, such as aggregated columns, row counts, and various mathematical and text operations.
Additionally, Power BI offers a range of built-in calculations, such as time intelligence features like Year-to-date Total, rolling averages, and running totals, among others. The user-friendly interface allows users to simply drag and drop their chosen fields into the appropriate sections, with Power BI efficiently handling the rest.
However, it’s crucial to keep in mind that the DAX measures generated by this tool should be validated to confirm they meet user requirements. The Quick Measure Suggestions with Co-Pilot feature doesn’t intend to negate the need for users to understand and craft DAX calculations. Instead, it serves as a supportive tool to streamline and expedite the report building process for users of all experience levels.

What are the Key Differences?
Tableau’s Ask Data and Power BI’s Quick Measure Suggestions with Co-Pilot both use natural language processing to simplify data analysis and report generation, making them more user-friendly and accessible for technical and business users. Ask Data focuses on providing instant responses in the form of automatic data visualizations based on natural language queries. It covers sophisticated data analytics concepts like time series and spatial analysis and can be accessed via different methods in Tableau.
On the other hand, Power BI’s Quick Measure Suggestions with Co-Pilot emphasizes simplifying DAX measure creation through natural language expressions. It aids in generating DAX measures for various scenarios and fosters faster report building. Both BI tools facilitate data analysis using natural language, but they differ in their primary functionalities—Ask Data is about generating visual responses to data queries, while Quick Measure Suggestions with Co-Pilot is about streamlining the creation of DAX measures.
What’s to Come?
Tableau
Launching in Spring 2024, Tableau GPT and Tableau Pulse represent significant advancements in the data domain. Tableau GPT brings generative AI to the data analytics world, allowing it to streamline our data interactions. This isn’t merely an advanced feature; it’s anchored on a reliable platform named Einstein. Rather than simply combining Tableau with OpenAI’s GPT, Einstein GPT integrates Large Language Model (LLM) technology with Tableau, adopting Salesforce’s established data governance framework. This ensures the credibility of external data and safeguards an organization’s private data from exposure when merged with external sources, as emphasized by Tableau, making it a secure choice.
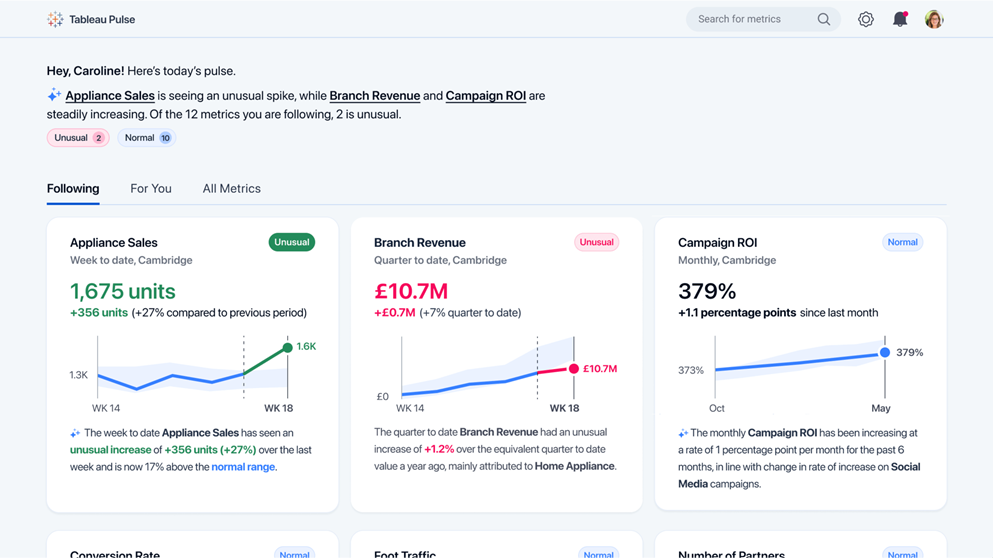
Tableau Pulse provides automated data insights and personalized analytics to users. Its aim is to empower everyone to feel proficient with data rather than being overwhelmed by charts and figures. Pulse delivers precisely what you require, precisely when you need it. Think of it as your tailored newsfeed for work-related metrics. The more you engage with it, the more adept it becomes at presenting what’s important to you. Hence, there’s no need to sift through countless charts; Pulse ensures everything remains concise and pertinent.
Tableau GPT and Pulse benefit data analysts by automating many of their routine tasks. They receive recommendations for visualizing their data, and the system even outlines the data’s origins. For everyone else, these new features translate intricate data into straightforward language. Imagine having someone anticipate your next question and then provide an answer.
Power BI
Microsoft offers Fabric and Copilot in Power BI. Fabric is an innovative analytics solution that consolidates an organization’s varied data and analytics into a single, unified Software as a Service (SaaS) platform, combining the strengths of Microsoft Power BI, Azure Synapse, and Azure Data Factory. It has been designed to enhance collaboration among data professionals, with the aim of fostering a strong data-focused culture within organizations. It provides six distinct experiences: data integration powered by Data Factory, data engineering, data warehousing, data science, real-time analytics powered by Synapse, and business intelligence with Power BI, all hosted on a lake-centric SaaS solution.
A new feature, Data Activator, is also under development to help users react instantaneously to data changes by setting up an automated alert system. Meanwhile, Copilot, currently in private preview as of July 2023, utilizes advanced generative AI to speed up the uncovering and sharing of insights. Business users can simply ask a question or specify the insights they need, and Copilot will create a comprehensive report, turning raw data into actionable insights in an instant. This positions it to compete directly with Tableau’s Ask Data.
If you’re interested in learning more about the differences between Tableau and Power BI capabilities, see Power BI vs Tableau – Which is Better?.
A Final Thought
Natural language processing is reshaping how we visualize data and engage with business information. Both Tableau and Power BI harness the power of natural language understanding, but each has its unique approach to understanding and responding to queries. As they evolve, both platforms are unveiling more dynamic ways for users to extract meaningful insights through NLP tools. Regardless of your preference for NLP in Tableau or Power BI, AI’s influence on data visualization is evident and here to stay.
There are many different factors that organizations must consider when sourcing BI platforms and BI tools. If you need assistance, our team of analytics consultants can guide you through the process. Our insight is impartial, so we recommend the solution that makes the most sense for your business.
Optimus SBR’s Data Practice
Optimus SBR provides data advisory services customized to support the needs of public and private sector organizations. We offer an end-to-end solution, from data strategy and governance to data infrastructure, engineering, analytics, data science, visualization, insights, and training.
Contact Us to learn more about our data practice and how we can help you on your data journey.

Optimus SBR Celebrates 6 Consecutive Wins as 2024 Best Workplaces™ in Professional Services
Our commitment to a people-first approach has been central to being recognized in 2024 for the sixth time as one of the Best Workplaces™ in Professional Services and the key to our overall success.

12 Best Practices to Increase Cross-Team Collaboration and Enhance Organizational Alignment
Enhancing cross-team collaboration drives innovation, optimizes resources, improves overall performance, and ensures every part of your organization works toward the same goals.

Enhancing Your Data Strategy for Success: The Power of Metadata
Metadata goes beyond just aiding in data retrieval. It ensures your data is secure, compliant and, most importantly, understood consistently by everyone in the organization.

Optimizing Language Translation Strategies: Beyond Compliance to Enhanced Operational Efficiency
The introduction of Quebec’s Bill 96 in Canada underscores the necessity for comprehensive translation strategies. Integrating machine translation technologies helps meet regulatory requirements while enhancing translation speed, cost efficiency, and operational effectiveness.

How to Manage Gen Z: 16 Strategies to Engage and Retain Young Talent
These practical strategies lead to a workplace that is better aligned with the values and expectations of Gen Z employees, ensuring that your efforts to attract and retain Gen Z talent are both successful and sustainable.

How to Measure the Success of Learning and Development: 12 Important Metrics to Evaluate
Quantifying the success of L&D training programs can be challenging. Learn about selecting and measuring the right metrics to determine whether your training efforts are truly making an impact.


