Power BI and Tableau are the most popular business intelligence tools on the market. Both deliver exceptional dashboards and contain all the basic capabilities an organization would need. Although the tools are similar, there are key differences that organizations should be aware of when considering analytical requirements.
Performance & Deployment
Tableau
Because Tableau is a columnar based structure, it can fetch and process billions of rows without impeding performance; users can also leverage Hyper Extracts to process large and/or complex data sets. The downside is that although Tableau offers cloud-hosted solutions with Tableau Online and Tableau CRM, it does not have a cloud-native architecture. On-premises customers can experience limitations in their scaling solutions such as the inability to use the cloud’s elasticity for dynamic workloads. Yet, if deployment flexibility is important, Tableau has more cloud-based and on-premises options than Power BI.
Power BI
Power BI does not handle bulk data as well as Tableau and does impose a limit on the amount of data set storage. With a Pro license there is a limit of 10 GB; larger data sets require a Power BI Premium license. That said, 10 GB should suffice for most users. As for deployment, Power BI does offer on-premises and cloud versions, with Azure available only for cloud deployments.
Data Preparation
Both Tableau and Power BI offer a tool to transform data prior loading it for visualization.
Tableau
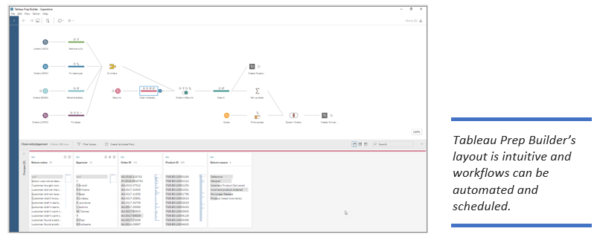
With a Creator licence, Tableau includes a stand-alone application called Tableau Prep Builder to profile, analyze, clean, and execute common data preparation tasks. Users with minimal technical experience can quickly learn the required skillset thanks to its smart features. These range from data cleaning to visual layout of the data preparation process, similar to other Extract, Transform and Load (ETL) tools on the market.
Power BI
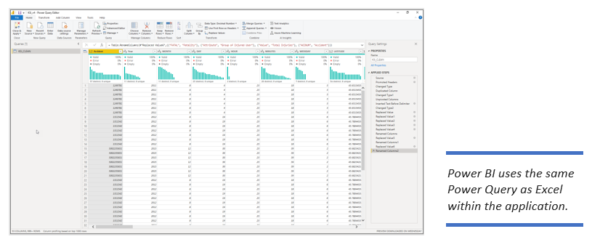
Data preparation in Power BI is integrated in the desktop application itself using Power Query, just like other Microsoft products such as Excel. Hence, it provides a more seamless experience than Tableau and users do not need a paid license. Power Query Editor offers very similar ETL capabilities to Tableau Prep Builder, yet users might find it less intuitive when numerous queries are required, since there is no visual layout of the process itself. However, it can perform more advanced ETL operations by allowing users to write their own queries using Power Query Formula Language (M).
Learning Curve
Tableau
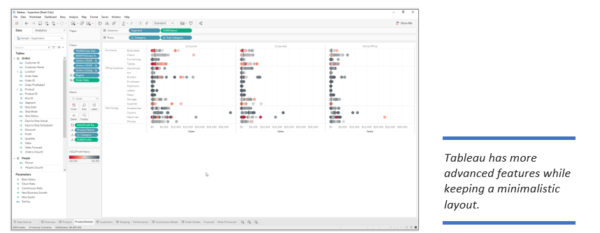
Tableau’s minimalistic layout can require some adjustment for beginners as the options are not obvious. Users with no prior BI experience might need some basic training to understand the fundamentals. However, Tableau’s learning curve is not significantly steeper than Power BI’s and some users might prefer Tableau’s more intuitive Visual Query Language versus Power BI’s DAX language.
Power BI
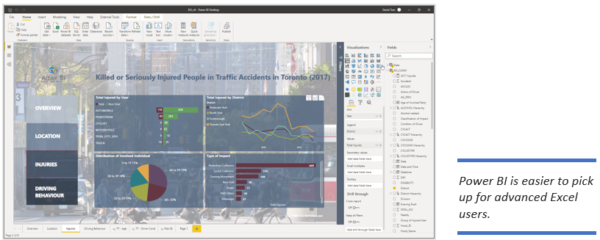
Power BI is generally considered easier to learn than Tableau because its layout is similar to other Microsoft Office 365 applications. The top ribbon is familiar to Excel users which allows them to easily navigate between features and capabilities. Creating a visualization can also feel more straightforward by choosing the type of visualization first, then dragging and dropping fields to identified inputs.
Data Visualization
Tableau
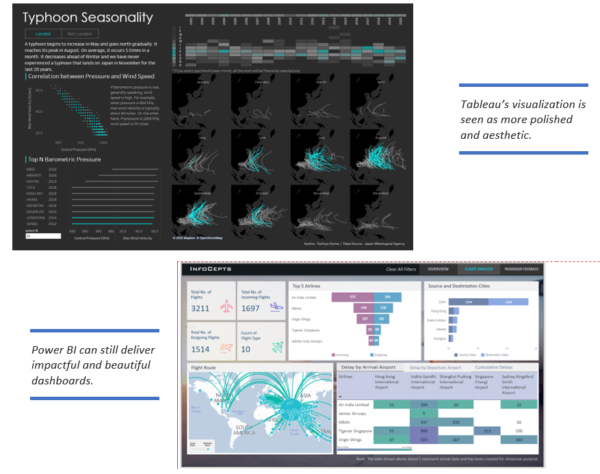
Tableau facilitates the creation of more functional and aesthetic data visualizations. When comparing visualizations in Tableau Public Gallery with Power BI Data Stories Gallery, it is apparent that Tableau delivers more impressive looking data visualizations even when large amounts of data points are involved.
Power BI
For most users though, Power BI satisfies their reporting needs and delivers impactful dashboards.
Sharing and Collaborating
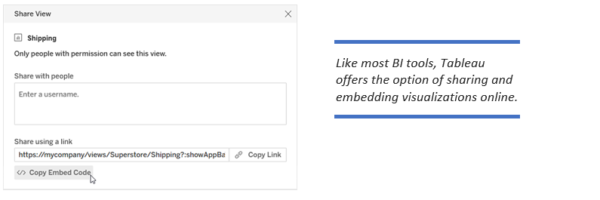
In both cases, dashboards and reports can be uploaded to a web service viewed by users either within the organization or to external users. The control of access, the option to subscribe to reports (as to stay up-to-date) or the option for multiple users to edit the reports online are features included in both tools.
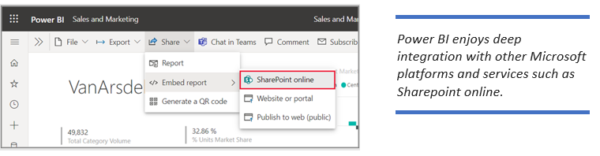
Where they differ is the ease of collaborating and sharing between teammates. Because Power BI can integrate with other Microsoft products such as SharePoint and O365, organizations already using Microsoft products and services, can find collaboration more natural and less disruptive, as opposed to a transition to a new product such as Tableau. For example, users can connect to excel files hosted on SharePoint, share reports using Teams and embed them on SharePoint documents for internal consumption.
Cost
Tableau
Tableau licences follow a straightforward monthly rate based on the type of licence and deployment. For a deployment fully hosted by Tableau Online, the pricing is slightly more expensive than for one that only includes Tableau Server.
Power BI
Overall, Power BI is considerably less expensive than Tableau and as such is a more affordable option for smaller organizations. However, Tableau’s premium pricing might be justified by it’s support for large data and additional functionalities that Power BI does not have.
There is only one type of individual licence and Power BI pricing depends on whether Power BI Premium is enabled. In sum, Power BI Premium is a capacity-based license for organizations requiring greater scale and performance for their content. It does offer additional features and capabilities, notably the ability to share Power BI content with anyone without purchasing a per-user license.
Both tools offer free options, but their limitations differ. With a free license in Power BI, although users have access to all the software’s capabilities, they can’t collaborate or share their reports. Conversely, with Tableau Public, Tableau’s free option, all published data sources and dashboards are open to the public.
Machine Learning
Tableau
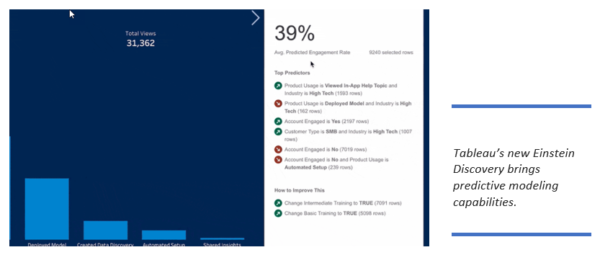
In March 2021, Tableau introduced Einstein Discovery, a new feature capable of creating predictive models. This was a long anticipated and overdue feature to rival Power BI.
Power BI
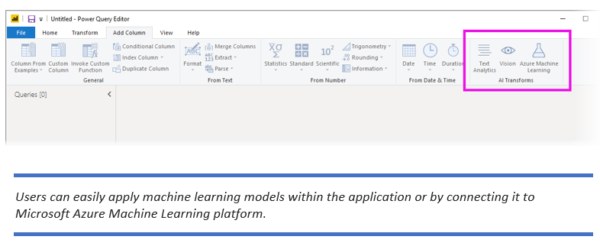
Microsoft has made great strides in introducing machine learning capabilities to users that are not necessarily tech savvy by minimalizing required programming skills. For instance, with Premium capacity, users can apply Microsoft machine learning models for text and visual analytics within the desktop app, with a few clicks. Power BI also enjoys deep integration with other Microsoft services such as Azure Machine Learning and SQL Server Base Analysis Services. These features cost extra but can be the right approach for organizations looking to apply simple or common machine learning models quickly.
Natural Language
Tableau
Tableau’s “Ask Data” is a cutting-edge feature that facilitates data querying via natural language, rendering data visualizations as responses. Query-building is expedited through automatic search and display of relevant data fields, functions, and string values, further assisted by dynamic phrase suggestions. Queries can be tailored by adding fields, filters, aggregation types, or groupings.
Power BI
The “Quick Measure Suggestions with Co-Pilot” feature in Power BI is backed by machine learning and offers a more intuitive and efficient method of creating DAX measures. It reduces the reliance on intricate DAX codes or templates, substituting them with easy-to-use natural language expressions. The Quick Measure Suggestions with Co-Pilot feature doesn’t intend to negate the need for users to understand and craft DAX calculations. Instead, it serves as a supportive tool to streamline and expedite the report building process for users of all experience levels.
Support
Tableau
Tableau has a knowledge base for most common “how-to” and troubleshooting issues. That said, it is with its strong online community that Tableau outshines Power BI. Tableau users tend to be more passionate about data visualization than their counterpart, perhaps due to the better end user experience and more aesthetic visualizations. Tableau’s longer presence on the market also helps in creating a more active community.
Power BI
Support for Power BI continues to improve with it growing popularity and increase in content and organized community events.
Summary
Performance & Deployment: Tableau can handle large volumes of data and has more options for deployment than Power BI.
Data Preparation: Power Query can be used in Power BI and is within the desktop application itself. Tableau has a stand-alone application that is easier to use but less seamless.
Learning Curve: Power BI is easier and faster to learn due to its familiar Office 365 layout, but Tableau has Visual Query Language which is more intuitive that Power BI’s DAX.
Data Visualization: Tableau has an edge on creating more attractive visualizations than Power BI and offers more advanced features.
Sharing and Collaborating: Organizations adopting Microsoft products and services in their workflows will it find easier to share and collaborate with Power BI. If Salesforce’s products and services are used, Tableau would be a better option.
Cost: Power BI is more affordable for small teams. Tableau can be a better option for larger organizations.
Machine Learning: Power BI has more advanced machine learning capabilities due to its deep integration with other Microsoft platforms, such as Azure Machine Learning.
Natural Language: Both tools facilitate data analysis through the use of natural language, but they differ in their primary functionalities—Tableau’s “Ask Data” is about generating visual responses to data queries, while Power BI’s “Quick Measure Suggestions with Co-Pilot” is about streamlining the creation of DAX measures.
Support: Tableau has a stronger support community because it was developed before Power BI. However, online content can easily be found for either, since these are the most widely used BI tools today.
A Final Thought
While this article provides a good overview of Tableau versus Power BI, there are many different factors that organizations must consider when sourcing a BI tool. Our team of consultants can guide you through the process, making sure the right questions are being asked to come to the solution that makes sense for your business.
Optimus SBR’s Data Practice
Optimus SBR provides data advisory services customized to support the needs of public and private sector organizations. We offer an end-to-end solution, from data strategy and governance to visualization, insights and training. Click here for more information on our Data practice and how we can help you on your data journey.


Industry Insights
Service Insights
Case Studies
Company News