

The explosive growth of data has provided incredible business opportunities but has also presented challenges for many companies. One of the biggest challenges is ensuring data accuracy. Although we have seen some companies with robust data validation processes, more often companies are in dire need of a systematic and disciplined approach. It is not unusual for business users to tell us they receive inaccurate or questionable data from their data team! The use of “bad” data can significantly impact the performance of the business and, in some cases, prove catastrophic.
What is Data Validation, and Why is it Essential?
Data validation, a form of data cleansing, is the process of verifying data quality and accuracy before using it.
As a business user, you may not realize that raw data rarely meets an organization’s analytical needs, so it must be manipulated into a form suitable for further analysis. Any data process requiring large volumes of data to be transformed, merged, and cleansed is intrinsically error-prone – the more data, the greater the likelihood of error.
For example, when moving and integrating data from different sources and repositories, it may not conform to business rules and may become corrupted due to inconsistencies in type or context.
“Bad” data can be prevented by following best practices for data validation. The goal of implementing good data validation techniques is to create data that is consistent, accurate, and complete to ensure the data presented to business users in reports, dashboards, or other tools is correct.
Why is data validation important? When data is consistently accurate, business users trust reports and can confidently make critical decisions based on the right data. If data can’t be trusted, insights from reports or data visualizations can’t be trusted, and ultimately, companies won’t be able to make data-driven decisions.
3 Data Validation Best Practices to Prevent “Bad” Data
1. Start by Verifying Source Data
As a first step, it is critical that the data from each source follows Data Quality measures to ensure that the validation process begins with “high-quality” data.
“High quality” data indicates data meets the organization’s needs in terms of operating, and decision and planning support.
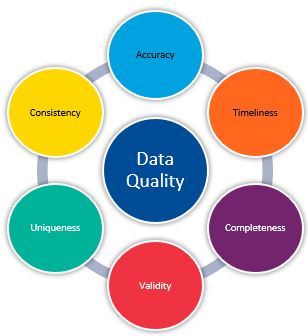
The following Data Quality measures should be verified for each data source:
Accuracy: Are the data records error-free, and can they be used as a reliable source of information?
Data Completeness: Is data complete for all relevant information?
Consistency: Does information in one table match the same information in another?
Timeliness: Is data readily available when the business needs it?
Validity: Does data follow business rules? Business rules are a set of actions or constraints that are applied to data to comply with data quality standards as well as make the data usable and meaningful to non-technical data consumers.
Uniqueness: Do tables consist of unique data sets or is data repeated among tables?
It is strongly recommended that a proactive approach be taken to identify potential data inconsistencies early to avoid the complexity, cost, and time of fixing them during later stages of the project.
2. Data Validation During Integration
Data integration is a process that combines data from multiple sources into a single unified data repository.
Once data quality measures have been verified for all data sources, there are many different transformations, integrations, and aggregations required for large volumes of data within an ETL (Extract, Transform, Load) process.
ETL (Extract, Transform, Load) is a data integration process that collects data from original sources (Extract), cleans and combines it into a format that can be analyzed (Transform), and centralizes it into a target repository (Load).
If any single one of the ETL processes is not developed correctly, the resulting metrics will be inaccurate. This in turn may result in unjustified decision making at the business level. Analytics are only as good as the data that supports it, so it is crucial to implement best practices early when developing ETL workflows.
Optimus SBR Data uses our ADM – Analytical Data Mart to blend multiple, disparate data sources for further analytics and data visualization. Data validation is built into the ADM framework, and each of the ADM’s three tiers – landing, integration, and analytics – has a specific purpose and set of validation techniques.
Since a report or dashboard is only as useful as the data that powers it, creating test cases to support data accuracy is crucial in the validation process. Each tier has its own set of test cases that support that tier’s purpose. ETL testing ensures data transfer from different sources to a target strictly adheres to transformation rules and complies with all validity checks.
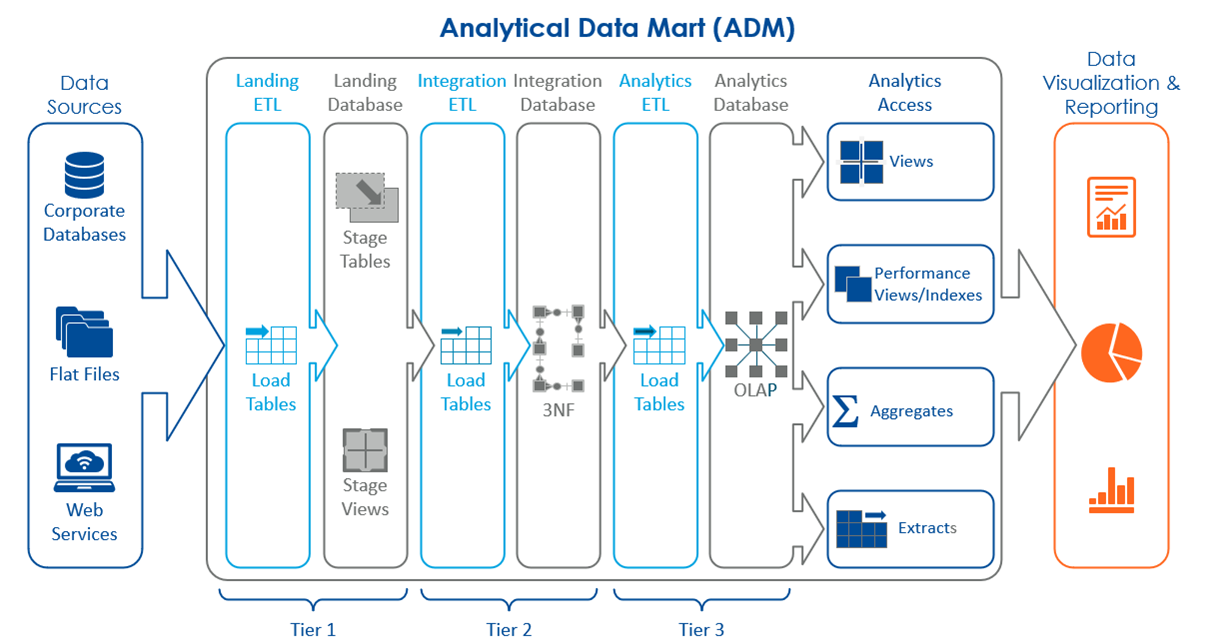
Landing Tier 1 maintains an exact copy of data from the source tables to ensure that a source reference is always available.
Test cases: Since the landing layer is an exact copy of the original data, the record values and data types must match. The test case for the Landing Tier involves performing a count of records and a list of the metadata of the original and the copy. If these tests are successful, a more detailed test can be performed comparing the values of the original and copy using an ETL tool such as KNIME or Alteryx.
Integration Tier 2 combines the raw data from the landing layer by applying transformations and data structure best practices (e.g., consolidations, aggregations, removal of duplicates).
Test cases: There are several test cases involving the data structure that must be created at the Integration Tier to test relationships between fields, tables, and structure.
Data redundancy: Normalization is applied to reduce data redundancy. This divides large redundant tables into smaller tables with a specific purpose and links them using relationships.
Data Integrity: Validation occurs before inserting, updating, or deleting the data. Tests can be performed to determine if the metrics contain any incorrect data (e.g. if sales contain any negative numbers or name fields contain special characters). Another test to ensure data integrity would be to insert inconsistent data to ensure it fails (e.g. insert a product number with 8 characters when the format is 7).
Parent/child: Data behaviour also requires testing. The database should indicate an error when a child record is inserted before a parent record. For example, when a sale is added that contains a product number that does not exist in the product table.
Cardinality: Involving the relationship of data in one table joined with another table, cardinality refers to whether a relationship is one-to-one, many-to-one, or many-to-many. For example, when testing the relationship between a sales fact table and a product dimension table, many of the products will be the same, but a product dimension table will have unique product values, so joining these tables will create a many to one relationship.
To test the cardinality, a distinct list of the primary keys (fields designated to identify unique records) is pulled in both tables. The table with the cardinality ‘one’ will have unique values, while the table with the cardinality ‘many’ will not. If the product table has duplicate Product IDs, we know that it will involve some cleansing.
Analytics Tier 3 transforms data from the integration layer to create tables and marts that apply specifically to the business. The analytical layer is pulled by a data analyst or data scientist to be used by the business. The function of this layer is to answer real business questions, so it is important to test scenarios that the business will regularly ask.
Test cases: For a retail store, for example, an analyst would create a table with metrics such as sales, margin, and cost that are sliced by dimensions such as region, brand, and product. The resulting information would answer questions like:
What are the sales by region for this year?
What are the 5 least profitable stores this month?
Which stores improved their sales the most compared to last year?
Test cases are performed that align with how the business slices its data. The answers can then be cross-referenced with data from each tier to verify data accuracy.
3. Automate Tasks for More Efficient Data Validation
When large volumes of data are being validated for analytics, manual data validation can not only be error-prone but very time-consuming. A great way to increase the efficiency of data validation is to automate tasks using SQL functions. Specific test cases are queried by looking at metrics and comparing the source value and destination value. Queries are named by using a function, so that function can be run when you make changes to the ETL process. Here is a sample output:
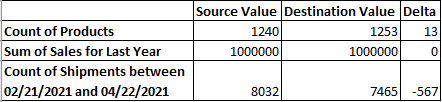
A significant delta will indicate which tables and fields are producing problems in the workflow, so they can be rectified. This greatly reduces the amount of manual work, reduces errors, and speeds up the process of accurate data validation.
A Final Thought
Performing data validation has become increasingly important and complex with the massive data projects Optimus SBR is seeing. Businesses need to have absolute trust in their data, and decisions must be based on accurate and reliable data. The solution is to implement and adhere to a rigorous data validation process that follows the…
3 Best Practices to Prevent “Bad” Data
- Verify Source Data: Start with verifying data quality for each data source before beginning the integration processes.
- Validate Data During Integration with Test Cases: Employ the ADM – Analytical Data Mart to perform ETL processes. The ADM has built-in data validation techniques at each tier (Landing, Integration, and Analytics) and uses test cases to support data accuracy.
- Automate Data Validation: Automate validation tasks for greater accuracy and efficiency.
Optimus SBR’s Data Practice
Optimus SBR provides data advisory services customized to support the needs of public and private sector organizations. We offer an end-to-end solution, from data strategy and governance to visualization, insights, and training.
Contact Us for more information on our Data Practice and how we can help you on your data journey.

Optimus SBR Celebrates 6 Consecutive Wins as 2024 Best Workplaces™ in Professional Services
Our commitment to a people-first approach has been central to being recognized in 2024 for the sixth time as one of the Best Workplaces™ in Professional Services and the key to our overall success.

12 Best Practices to Increase Cross-Team Collaboration and Enhance Organizational Alignment
Enhancing cross-team collaboration drives innovation, optimizes resources, improves overall performance, and ensures every part of your organization works toward the same goals.

Enhancing Your Data Strategy for Success: The Power of Metadata
Metadata goes beyond just aiding in data retrieval. It ensures your data is secure, compliant and, most importantly, understood consistently by everyone in the organization.
Optimizing Language Translation Strategies: Beyond Compliance to Enhanced Operational Efficiency
The introduction of Quebec’s Bill 96 in Canada underscores the necessity for comprehensive translation strategies. Integrating machine translation technologies helps meet regulatory requirements while enhancing translation speed, cost efficiency, and operational effectiveness.

How to Manage Gen Z: 16 Strategies to Engage and Retain Young Talent
These practical strategies lead to a workplace that is better aligned with the values and expectations of Gen Z employees, ensuring that your efforts to attract and retain Gen Z talent are both successful and sustainable.

How to Measure the Success of Learning and Development: 12 Important Metrics to Evaluate
Quantifying the success of L&D training programs can be challenging. Learn about selecting and measuring the right metrics to determine whether your training efforts are truly making an impact.