Insights
Dive into this diverse array of articles, case studies, and expert viewpoints designed to inspire and inform.
How to Measure the Success of Learning & Development: 12 Important Metrics to Evaluate
< 1 Minute Read
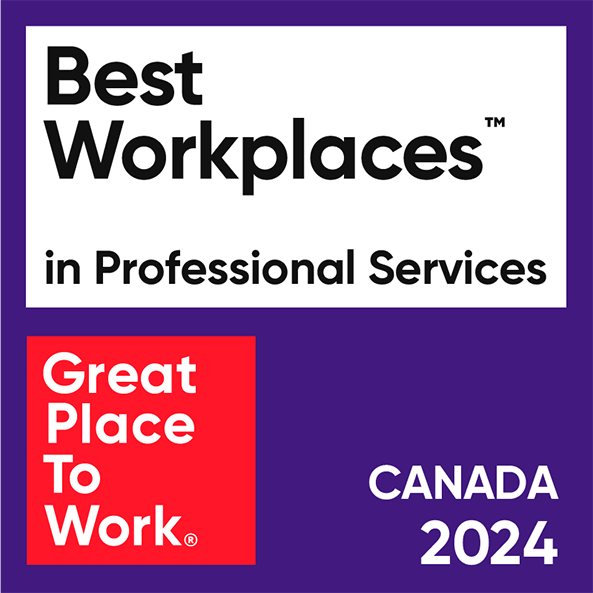
Optimus SBR Celebrates 6 Consecutive Wins as 2024 Best Workplaces™ in Professional Services
Optimus SBR Celebrates 6 Consecutive Wins as 2024 Best Workplaces™ in Professional Services
With an inspiring culture that prioritizes employee happiness and growth, Optimus SBR is more than a consulting firm; it’s a place to grow, thrive, and make a difference.
2 Minute Read
12 Best Practices to Increase Cross-Team Collaboration and Enhance Organizational Alignment
12 Best Practices to Increase Cross-Team Collaboration and Enhance Organizational Alignment
In the age of agile methodologies and remote work, mastering cross-team collaboration is pivotal in driving innovation and ensuring that all parts of a company are working towards the same objectives.
9 Minute Read
Enhancing Your Data Strategy for Success: The Power of Metadata
Enhancing Your Data Strategy for Success: The Power of Metadata
Metadata goes beyond just aiding in data retrieval. It ensures your data is secure, compliant and, most importantly, understood consistently by everyone in the organization.
7 Minute ReadOptimizing Language Translation Strategies: Beyond Compliance to Enhanced Operational Efficiency
Optimizing Language Translation Strategies: Beyond Compliance to Enhanced Operational Efficiency
The introduction of Quebec's Bill 96 in Canada underscores the necessity for comprehensive translation strategies including the integration of machine translation technologies.
5 Minute Read
Industry Insights
Service Insights
Case Studies
Company News